| Polarized Cytokinesis |
| |
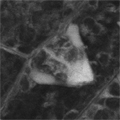
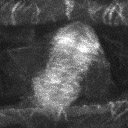
| Components of the cytokinetic apparatus as visualized with EGFP |
| |
 |
| |
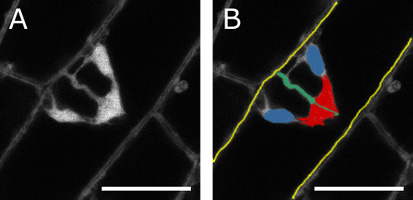
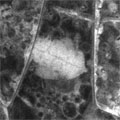
| Single confocal section showing a polarized cytokinetic structure in a hypocotyl cell expressing free EGFP. This marker localizes to the cytosol and to the lumen of the nucleus. Yellow - cell cortex, Red - phragmoplast, Green - cell plate and cell plate precursors, Blue - daughter nuclei. The scale bar = 10 microns. Click to see a confocal stack of this cell. |
| |
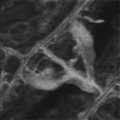
| Early cytokinetic structures |
| |
 |
|
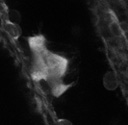
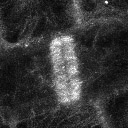
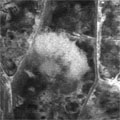
Rotation of a 3-D reconstruction of an Arabidopsis hypocotyl cell expressing EGFP. This movie is a rotation of the computer projection shown in Figure 1C. The early cytokinetic apparatus is located adjacent to the cell cortex and appears to be making initiate contact with it. Daughter nuclei are visible as aggregations of label at either end of a spindle-shaped assembly of cytosol. |
 |
|
|
| |
 |
|
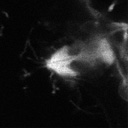
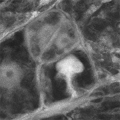
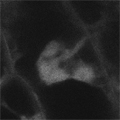
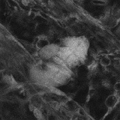
Confocal stack taken through a cytokinetic structure in which many tubule-like projections are seen to reach into the vacuolar space. Hypocotyl cell expressing EGFP. |
|
|
|
| |
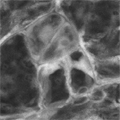
| Mid-phase phragmoplasts |
| |
| A |
|
B |
C |
D |
 |
|
 |
 |
 |
|
|
|
|
|
| |
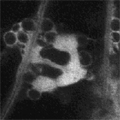
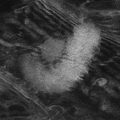
| Rotations of 3-D reconstructions of epidermal cells expressing EGFP. These images illustrate the polar orientation of the phragmoplast, its attachment at one side of the cell and its crescent shape. (A) Depicts the petiole cell shown in Figure 1A. (B) Is a subsidiary cell in the hypocotyl. (C) And (D) are later timepoints of (A) and (B) respectively, showing the completed growth of the cell plate across the cell. |
| |
| E |
|
F |
|
|
 |
|
 |
|
|
|
|
|
|
|
| |
| Rotations of 3-D reconstructions of epidermal cells expressing EGFP::TUB1. (E) Hypocotyl cell. (F) Petiole cell. The phragmoplast array of parallel microtubules are clearly marked in each series, and the adjacent daughter nuclei are dimly visible. The rotating reconstructions allow the cresent shape of these polarized phragmoplasts to be easily visualized. |
| |
| Time series - single optical plane |
| |
 |
|
 |
|
|
|
|
|
|
|
| |
| Time series of cotyledon petiole cells expressing EGFP. Images were collected every 15 seconds for 50 minutes. The image series illustrates the extreme polarity of cell plate growth in shoot cells. EGFP (left) and LE 8 (right). |
| |
| 3-D time series |
| |
| A |
|
B |
C |
D |
 |
|
 |
 |
 |
|
|
|
|
|
| |
| 3-D time series of cytokinesis in hypocotyl epidermal cells expressing the GFP::cDNA marker LE8. A z-series of confocal sections was acquired at each time interval and computer projections made of each image stack. (A) And (C) are projections made along the optical axis of the microscope; (B) and (D) are projections made at a 30° angle to the optical axis. The two traveling zones of interaction between the phragmoplast and the cell cortex are easily seen in these movies, as is the crescent shape of the mid-phase phragmoplast. The cell-cycle dependent nuclear localization of LE8 allows identification of early stages of mitosis, but as cytokinesis proceeds, the relative amount of LE8 label in the nuclear lumen diminishes (more on the LE8 marker). Image stacks in (A) and (C) were acquired every 30 seconds over 76 minutes. Images stacks in (B) and (D) were acquired every 3 minutes over 98 minutes. |
| |
| Time series of root cells expressing ER marker |
| |
 |
|
Time series acquired from root cortex cells of transgenic line Q8 that expresses an in-frame fusion protein to a membrane protein of unknown function. The marker highlights the ER membrane and developing cell plate. Both polarized and symmetrical modes of cytokinesis are evident. Images were acquired at 12-second intervals. |
|
| |
| Time series of root cells expressing nuclear marker |
| |
 |
|
Time series acquired from root epidermal cells of transgenic line N6 that expresses a nuclear fusion protein that associates with chromatin. Nuclei and condensed chromosomes are highlighted by this marker, but enough label exists in the cytosol to detect the formation and growth of the phragmoplast. Some cells (the upper two of the four undergoing division) show an obvious polarized mode of cytokinesis. |
|
| |
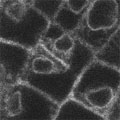
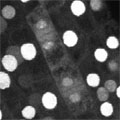
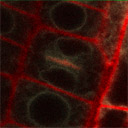
| Apoplastic continuity prior to the completion of cell plate development |
| |
 |
|
|
 |
| |
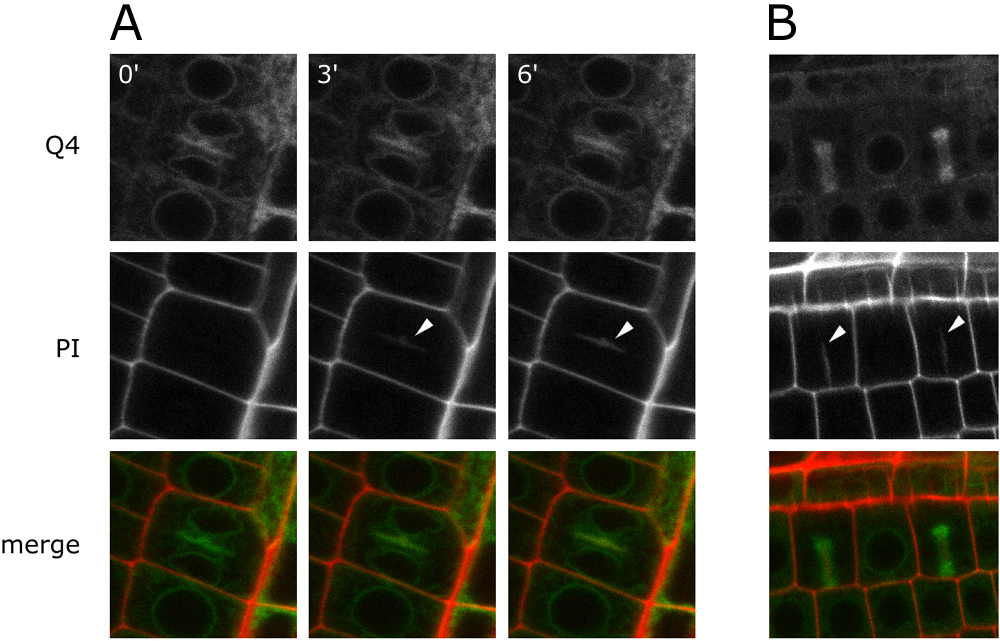
| Apoplastic continuity prior to the completion of cell plate development. (A) Root tip cells expressing Q4 are imaged in the presence of propidium iodide, a membrane impermeant dye that diffuses through and stains cell walls in the root (1). In this sequence, PI staining appears within the region of the cytokinetic apparatus marked by the Q4 label (arrowheads), although Q4 label does not yet extend to the lateral walls. (B) Root tip cells expressing EGFP::TUB1 and counter-stained with PI. Two dividing cells display phragmoplast arrays of microtubules. The centerlines of these phragmoplast arrays are labeled with PI. On this focal plane, the PI label in one cell appears to be contiguous with the parental cell wall. The simplest interpretation of these images is that the cell plate has fused to the parental cell wall at a point outside of the focal plane, allowing the PI to diffuse from the parental wall into the newly formed wall. The alternative explanation is that dye has crossed the plasma membrane, the cytosol, and the membrane of the new cell plate to enter the new wall. This possibility does not seem likely because PI has a high affinity for nucleic acids and no nuclear staining is evident. These images suggest that cell plate development in this cell is polarized, and that not only has the cell plate reached the cortex at a point outside of the focal plane, but is has also fused to the parental membrane. |
| |
 |
| |
|
|
| |